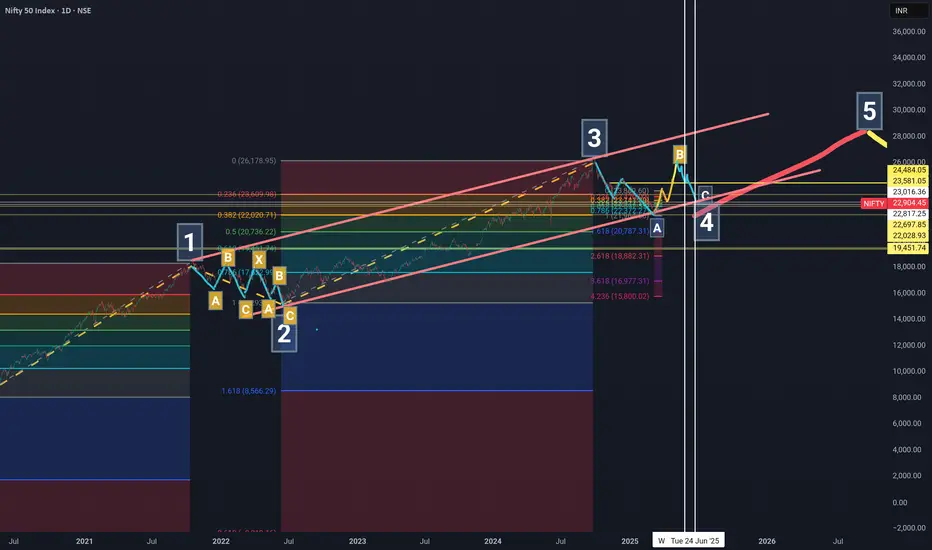
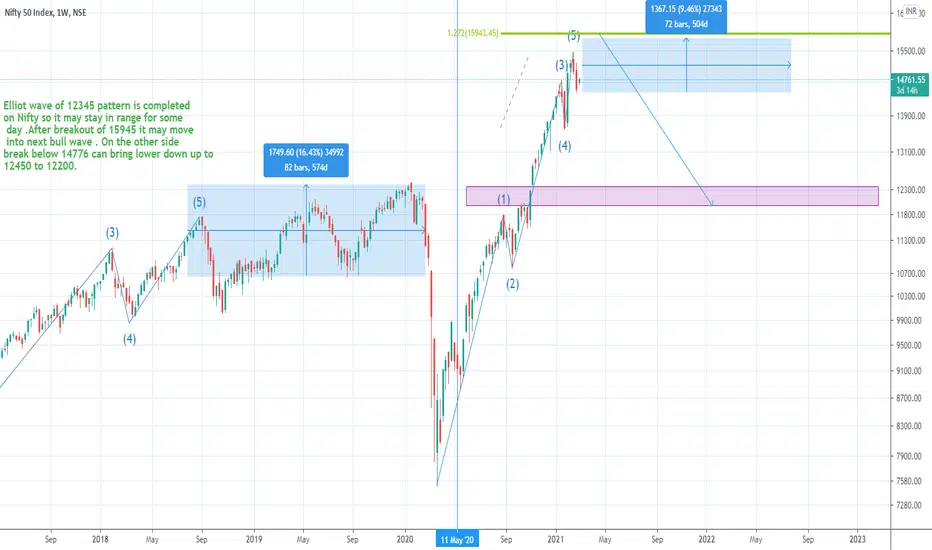
Elliot Wave Analysis for Nifty | Direction for April 7thNifty 50 is in 4th Wave of the Ongoing Cycle. Now as per rule of Alteration, if second Wave was sharp, fourth Wave is most likely to be a sideways. Also if second Wave was complex, 4th Wave is more likely to be simple.
Considering these rules, it is evident that current Wave could be a flat Wave of either simple type, or running flat type or extended flat type,
Amongst three, extended flat Wave is very less likely because it can breach the tunnel. The tunnel is created using peak of Wave 1 and Wave 3 and drawing a parallel to it that touches bottom of Wave 2. As per elliot Wave analysis, Wave 4 is very less likely to breach this Zone. Thus, it will stay within it.
Now within it, it doesn't have much room to go down. So only regular flat or running flat is possible.
Amongst the two, my assumption is it can go on to become a running flat Wave.
For that, it can go as low as fib retracement level of 61.8% at 22697 mark. From there it can most likely reverse and complete the wave B of Wave 4. Thereafter it will again fall to Wave c which since it will be a running flat, will end above the bottom of Wave A.
This is my analysis. Open the community views.
Discl: for learning purposes only, not buy sell recommendation.
Search in ideas for "Elliot wave"
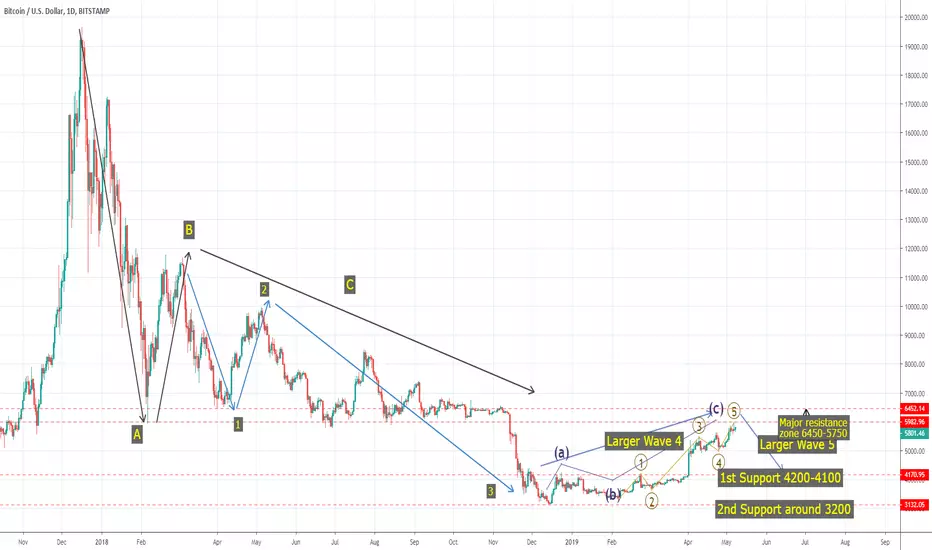
elliot wave analysis on nifty through my lensesElliot wave Analysis Through my Lenses
Elliot waves is at its best....
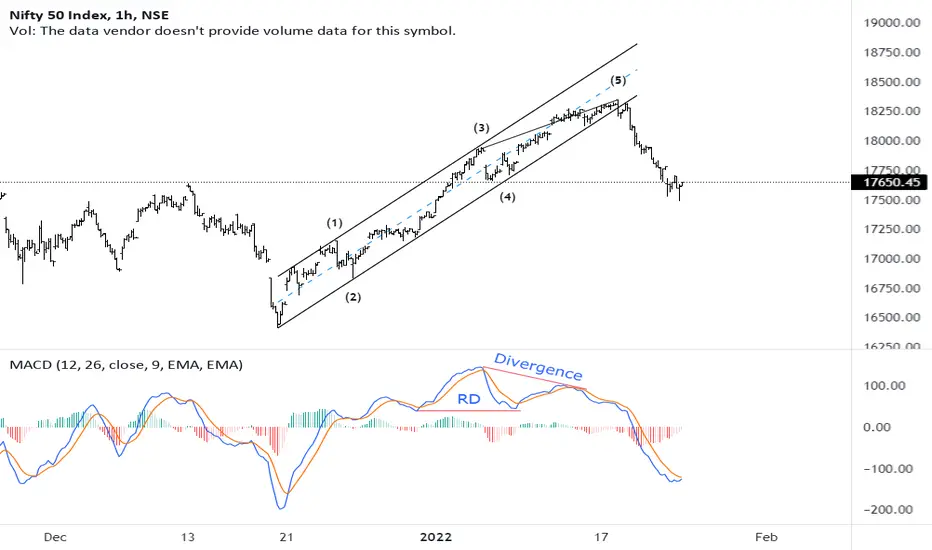
i have posted 3 hour and 1 hour chart of nifty ...those who are interested in elliot wave may take a look at the wave counts.
rest can leave it like that...IF TOP IS 11171 then we are going to see a bear market from here .. if not nifty will fight back soon... But at the moment bears are in total control ....
even dow/nasdaq and other indices are in positive mode...
nifty /sensex/banknifty and all other sectors are totally weak today.....
i want to share one more interested thing to u guys that is ....
i have been tracking FII/FPI and DII's activity and first time after so many days i hv noticed that on 5th march 2018
FII/FPI are net seller of 366.6 crores in cash..and DII are also net sellers of 154.2 crores..
after watching this i am very much convinced yesterday that we are going to fall if they (FII/DII ) will be net sellers ...
and guess what FII are net buyers today (620.08 cr) and DII
are net sellers (743.33 cr)... that means DII wins the battle today will se what is coming next ... the post is very lenghty but i guess will be very informative.....
thank u all please like and share your views as well ...
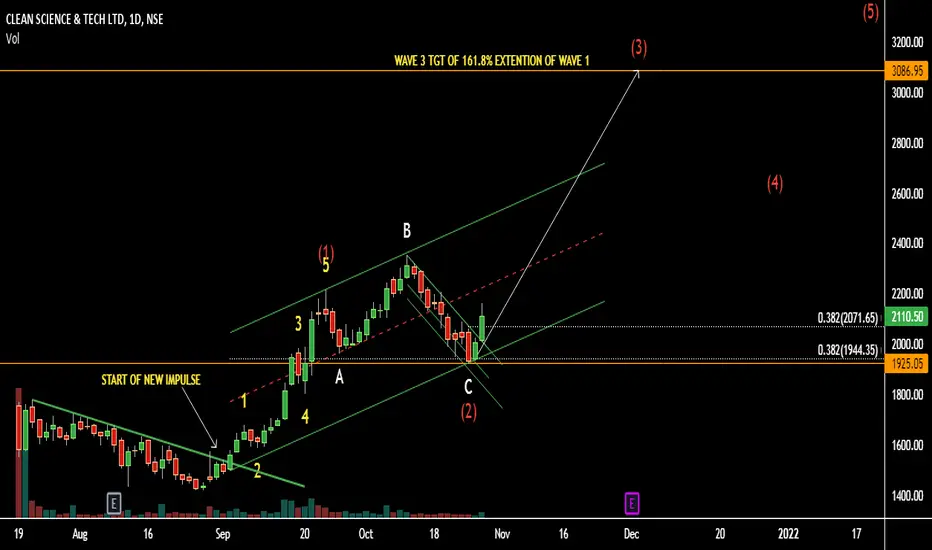
Elliot wave-3 beginning in Clean Science and Technology.ELLIOT WAVE COUNT FOR CLEAN SCIENCE AND TECHNOLOGY
SINCE IT'S LISTING IS HAS BEEN CORRECTING AND RESPECTING DOWN SLOPING TRENDLINE WHICH GOT BROKEN INDICATING CHANGE IN TREND.
IT SEEMS LIKE WAVE 3 HAS BEGAN AFTER LOOKING AT TODAYS PRICE MOVEMENT.
WAVE 3 TGT OF 161.8% WAVE 1 EXTENTION IS COMING AT 3088.WAVE 2 HAS ONLY RETRACED WAVE 1 BY 38.2% INDICATING WE MIGHT GET EXTENTION IN WAVE 3.
ONE CAN GET LONG AT CURRENT LEVEL OR ANY DIP TOWARDS 2071 WITH A STOP OF 1940 ON CLOSING BASIS WITH TARGET OF 3088 AS PER ELLIOT WAVE.
DISCLAIMER:There is no guarantee of profits or no exceptions from losses. The study provided is solely the personal views of my research. You are advised to rely on your judgment while investing/Trading decisions. Past performance is not an indicator of future returns. Investment is subject to market risks. Seek help of your financial advisors before investing/trading.
I may or may not trade this analysis
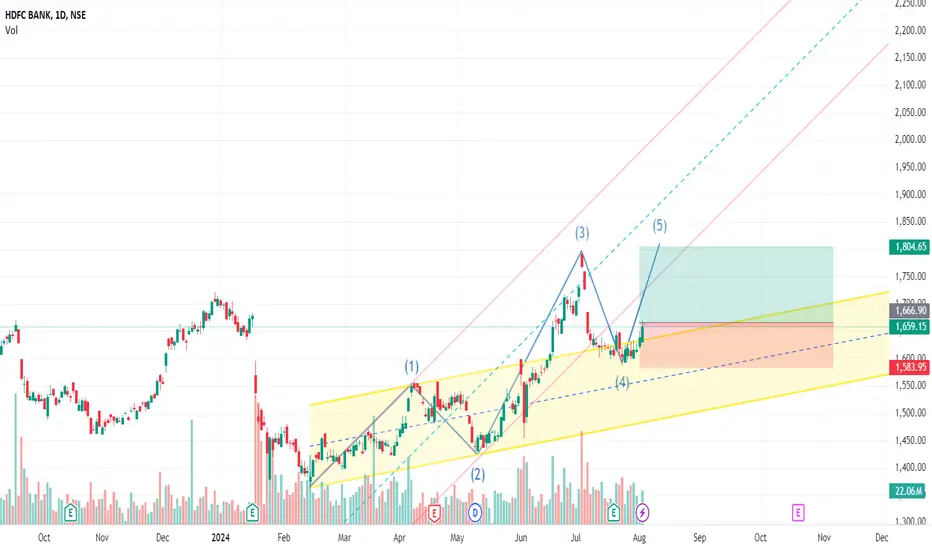
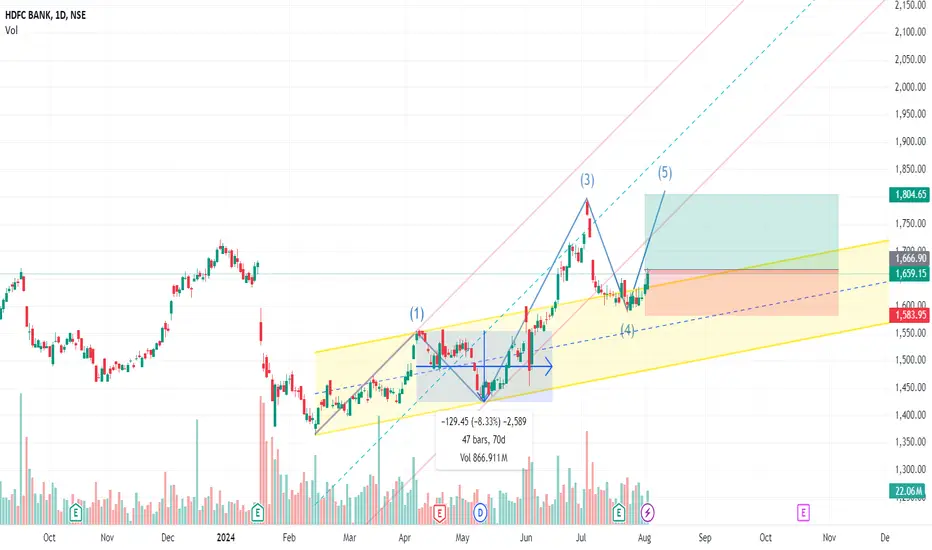
Elliot Wave based entry and target in HDFC BankElliot Wave based entry and target in HDFC Bank,Elliot Wave based entry and target in HDFC Bank,Elliot Wave based entry and target in HDFC Bank,Elliot Wave based entry and target in HDFC Bank,Elliot Wave based entry and target in HDFC Bank,Elliot Wave based entry and target in HDFC Bank,Elliot Wave based entry and target in HDFC Bank,Elliot Wave based entry and target in HDFC Bank
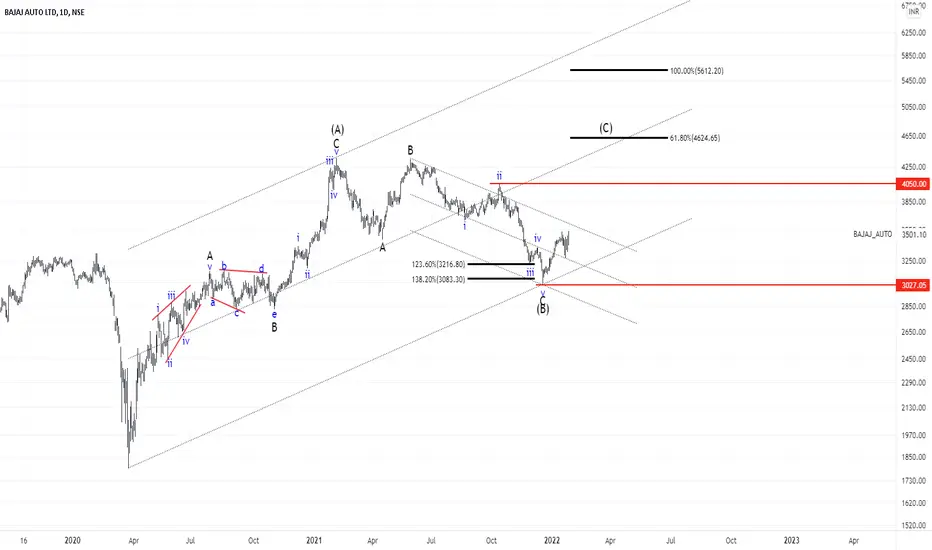
Elliot Wave View: NSE BAJAJ_AUTO (Long)Elliot Wave View: BAJAJ_AUTO Impulsive Rally Should Extend (Buy on dips)
January 27, 2022 NSE:BAJAJ_AUTO by Dinesh Naidu (Elliotician)
Hello Traders, In this technical analysis blog im going to take a quick look at the Elliot Wave Charts of BAJAJ AUTOCash NSE.
Long Term Elliot Wave view suggests low from December 20, 2021 could have ended at 3027.05 (138.2% FIB), and could extend higher from the current level, every fall in the price could give us a buying opportunity in BAJAJ_AUTO.
Initiation Range: BUY ON DIPS
Invalidation level: 3027.05
Positional Target: 4050, 4624.65
Disclaimer: The investments discussed or recommended in the market analysis, research reports, etc. may not be suitable for all investors. Investors must make their own investment decisions based on their specific investment objectives and financial position and only after consulting such independent advisors as may be necessary.
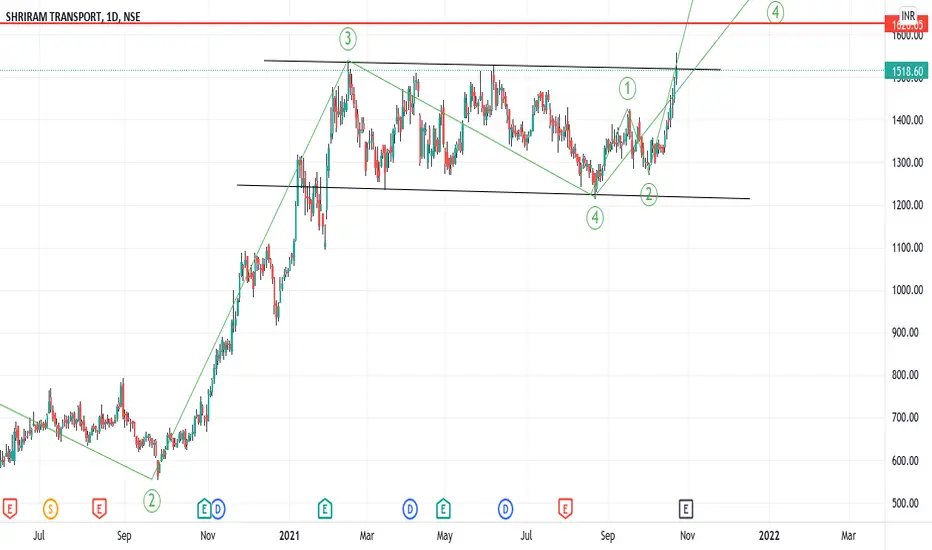
Elliot Wave TheoryElliot Wave Theory on SRTRANSFIN
It's in the 5th wave, And current wave is 5th of 3rd is ON
So trade with 3rd wave & enjoy rally
SLong
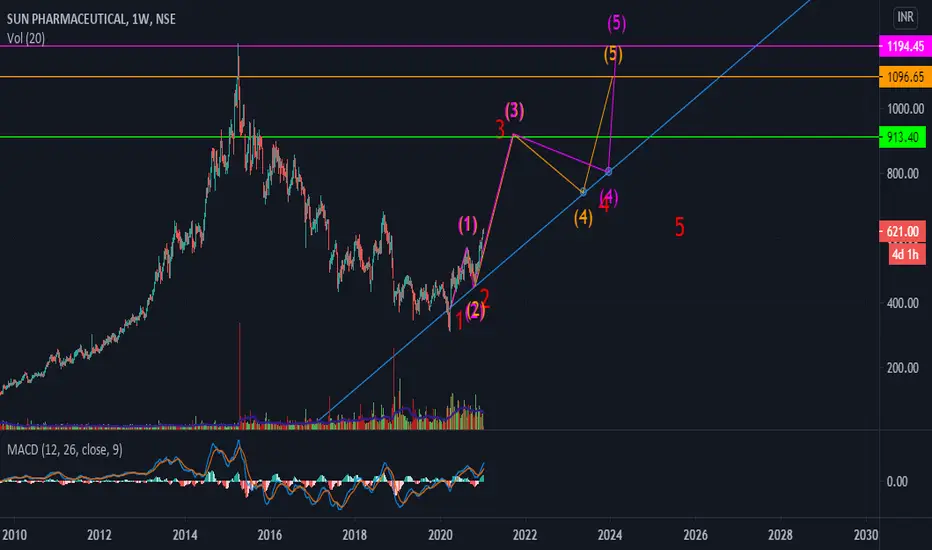
ELLIOT WAVE IN SUNPHARMAELLIOT WAVE ANALYSIS
WAVE 1 (UPTREND WAVE )FROM 397.65 TO 560
WAVE 2 (CORRECTION WAVE) RETRACED ABOUT 61.8% FROM 560 TO 450
WAVE 3 ( UPTREND WAVE ) 495 TO 925 (2.618 EXTENSION)
WAVE 4 (CORRECTION WAVE ) AS SHOWS IN CHART
WAVE 5 ( LAST BULL WAVE) AS SHOWN IN CHART
THESE ARE MY INDEPENDENT ANALYSIS . HOPE IT HELPS :)
Elliot Wave based entry and target in HDFC BankElliot Wave based entry and target in HDFC BankElliot Wave based entry and target in HDFC BankElliot Wave based entry and target in HDFC BankElliot Wave based entry and target in HDFC BankElliot Wave based entry and target in HDFC BankElliot Wave based entry and target in HDFC Bank
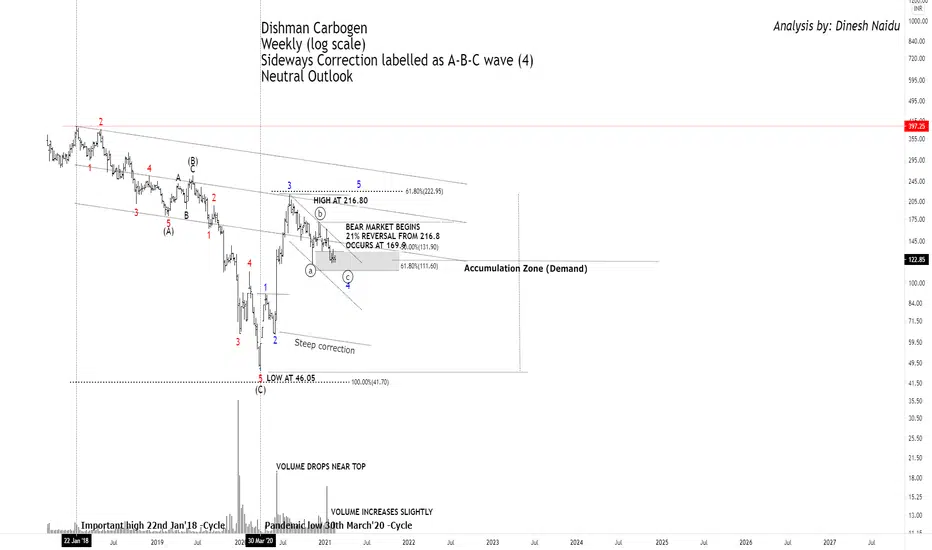
Elliot wave Analysis #DCALElliot Wave Theory Applied to the DISHMAN CARBOGEN (DCAL).Most of Elliot principle apply to the current marketplace, but some experience and interpretation is necessary.
The price decline in the 3rd wave of 216.80 addresses the issue: Are there
exceptions to the 21% rule that changes a bull market to a bear market? A 21%
drop from a high of 216.8 is 122.85, very close to the point where prices stopped their
decline and reversed.
Once the price breaks the above channel, we might expect a move till 200 mark. During the subsequent decline, prices attempted to rally.
Overall sentiment looks Neutral for DCAL, one can start accumulating at the current market price for the target of 170 to 200 odd levels in the coming months.
Any of our investment or trades we share on our blog are provided for educational purposes only and do not constitute specific financial, trading or investment advice. The blog is intended to provide educational information only and does not attempt to give you advice that relates to your specific circumstances.